| 1 | Burj Khalifa | 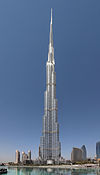 | Dubai |  United Arab Emirates United Arab Emirates | 828 | 2,717 | 163 (+ 2 below ground)[15] | 2010 |
| 2 | Merdeka 118 |  | Kuala Lumpur |  Malaysia Malaysia | 678.9 | 2,227 | 118 (+ 5 below ground)[16] | 2023 |
| 3 | Shanghai Tower |  | Shanghai |  China China | 632 | 2,073 | 128 (+ 5 below ground)[17] | 2015 |
| 4 | Abraj Al-Bait Clock Tower |  | Mecca |  Saudi Arabia Saudi Arabia | 601 | 1,972 | 120 (+ 3 below ground)[18] | 2012 |
| 5 | Ping An International Finance Centre |  | Shenzhen | China | 599.1 | 1,966 | 115 (+ 5 below ground)[19] | 2017 |
| 6 | Lotte World Tower |  | Seoul |  South Korea South Korea | 554.5 | 1,819 | 123 (+ 6 below ground)[20] | 2017 |
| 7 | One World Trade Center |  | New York City |  United States United States | 541.3 | 1,776 | 94 (+ 5 below ground)[21] | 2014 |
| 8 | Guangzhou CTF Finance Centre |  | Guangzhou | China | 530 | 1,739 | 111 (+ 5 below ground)[22] | 2016 |
| Tianjin CTF Finance Centre |  | Tianjin | 97 (+ 4 below ground)[23] | 2019 |
| 10 | China Zun |  | Beijing | 527.7 | 1,731 | 109 (+ 8 below ground)[24] | 2018 |
| 11 | Taipei 101 |  | Taipei |  Taiwan Taiwan | 508 | 1,667 | 101 (+ 5 below ground)[25] | 2004 |
| 12 | Shanghai World Financial Center |  | Shanghai | China | 492 | 1,614 | 101 (+ 3 below ground)[26] | 2008 |
| 13 | International Commerce Centre | 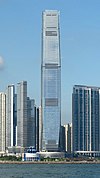 | Hong Kong | 484 | 1,588 | 108 (+ 4 below ground)[27] | 2010 |
| 14 | Wuhan Greenland Center |  | Wuhan | 475.6 | 1,560 | 101 (+ 6 below ground)[28] | 2023 |
| 15 | Central Park Tower |  | New York City | United States | 472.4 | 1,550 | 98 (+ 4 below ground)[29] | 2021 |
| 16 | Lakhta Center |  | Saint Petersburg |  Russia Russia | 462 | 1,516 | 87 (+ 3 below ground)[30] | 2019 |
| 17 | Landmark 81 | 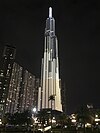 | Ho Chi Minh City |  Vietnam Vietnam | 461.2 | 1,513 | 81 (+ 3 below ground)[31] | 2018 |
| 18 | International Land-Sea Center | | Chongqing | China | 458.2 | 1,503 | 98 (+ 4 below ground) | 2024 |
| 19 | The Exchange 106 |  | Kuala Lumpur | Malaysia | 453.6 | 1,488 | 95 (+ 6 below ground)[32] | 2019 |
| 20 | Changsha IFS Tower T1 |  | Changsha | China | 452.1 | 1,483 | 94 (+ 5 below ground)[33] | 2018 |
| 21 | Petronas Tower 1 |  | Kuala Lumpur | Malaysia | 451.9 | 1,483 | 88 (+ 5 below ground)[34][35] | 1998 |
| Petronas Tower 2 |
| 23 | Zifeng Tower |  | Nanjing | China | 450 | 1,476 | 89 (+ 5 below ground)[36] | 2010 |
| Suzhou IFS |  | Suzhou | 95 (+ 5 below ground)[37] | 2019 |
| 25 | Wuhan Center |  | Wuhan | 443.1 | 1,454 | 88 (+ 4 below ground)[38] | 2019 |
| 26 | Willis Tower | 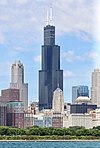 | Chicago | United States | 442.1 | 1,450 | 108 (+ 3 below ground)[39] | 1974 |
| 27 | KK100 |  | Shenzhen | China | 441.8 | 1,449 | 98 (+ 4 below ground)[40] | 2011 |
| 28 | Guangzhou International Finance Center |  | Guangzhou | 438.6 | 1,439 | 101 (+ 4 below ground)[41] | 2010 |
| 29 | 111 West 57th Street |  | New York City | United States | 435.3 | 1,428 | 84 (+ 2 below ground)[42] | 2021 |
| 30 | One Vanderbilt | 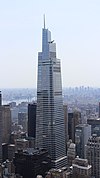 | 427 | 1,401 | 62 (+ 4 below ground)[43] | 2020 |
| 31 | 432 Park Avenue |  | 425.7 | 1,397 | 85 (+ 3 below ground)[44] | 2015 |
| 32 | Marina 101 | 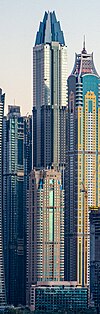 | Dubai | United Arab Emirates | 425 | 1,394 | 101 (+ 6 below ground)[45] | 2017 |
| 33 | Trump International Hotel and Tower |  | Chicago | United States | 423.2 | 1,388 | 98 (+ 2 below ground)[46] | 2009 |
| 34 | Dongguan International Trade Center 1 |  | Dongguan | China | 422.6 | 1,386 | 85 (+ 3 below ground)[47] | 2021 |
| 35 | Jin Mao Tower |  | Shanghai | 420.5 | 1,380 | 88 (+ 3 below ground)[48] | 1999 |
| 36 | Princess Tower |  | Dubai | United Arab Emirates | 413.4 | 1,356 | 101 (+ 6 below ground)[49] | 2012 |
| 37 | Al Hamra Tower |  | Kuwait City |  Kuwait Kuwait | 412.6 | 1,354 | 80 (+ 3 below ground)[50] | 2011 |
| 38 | Two International Finance Centre |  | Hong Kong | China | 412 | 1,352 | 88 (+ 6 below ground)[51] | 2003 |
| 39 | Haeundae LCT The Sharp Landmark Tower |  | Busan | South Korea | 411.6 | 1,350 | 101 (+ 5 below ground)[52] | 2019 |
| 40 | Guangxi China Resources Tower | | Nanning | China | 402.7 | 1,321 | 86 (+ 3 below ground)[53] | 2020 |
| 41 | Guiyang International Financial Center T1[54] | 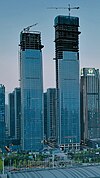 | Guiyang | 401 | 1,316 | 79 (+ 5 below ground)[55] | 2020 |
| 42 | China Resources Tower |  | Shenzhen | 392.5 | 1,288 | 68 (+ 5 below ground)[56] | 2018 |
| 43 | 23 Marina |  | Dubai | United Arab Emirates | 392.4 | 1,287 | 88 (+ 4 below ground)[57] | 2012 |
| 44 | CITIC Plaza |  | Guangzhou | China | 390.2 | 1,280 | 80 (+ 2 below ground)[58] | 1996 |
| 45 | Citymark Centre | | Shenzhen | 388.3 | 1,274 | 70 (+ 7 below ground)[59] | 2022 |
| 46 | Shum Yip Upperhills Tower 1 | 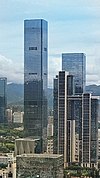 | 388.1 | 1,273 | 80 (+ 3 below ground)[60] | 2020 |
| 47 | 30 Hudson Yards |  | New York City | United States | 387.1 | 1,270 | 73 (+ 1 below ground)[61] | 2019 |
| 48 | Public Investment Fund Tower | | Riyadh | Saudi Arabia | 385 | 1,263 | 72 (+ 4 below ground) | 2021 |
| 49 | Shun Hing Square |  | Shenzhen | China | 384 | 1,260 | 69 (+ 3 below ground)[62] | 1996 |
| 50 | Eton Place Dalian Tower 1 |  | Dalian | 383.2 | 1,257 | 80 (+ 4 below ground)[63] | 2016 |
| 51 | Autograph Tower |  | Jakarta |  Indonesia Indonesia | 382.9 | 1,256 | 75 (+ 6 below ground) | 2022 |
| 52 | Logan Century Center 1 | | Nanning | China | 381.3 | 1,251 | 82 (+ 4 below ground)[65] | 2018 |
| 53 | Burj Mohammed bin Rashid | | Abu Dhabi | United Arab Emirates | 381.2 | 1,251 | 88 (+ 5 below ground)[66] | 2014 |
| 54 | Empire State Building |  | New York City | United States | 381 | 1,250 | 102 (+ 1 below ground)[67] | 1931 |
| 55 | Elite Residence | | Dubai | United Arab Emirates | 380.5 | 1,248 | 87 (+ 4 below ground)[68] | 2012 |
| 56 | Riverview Plaza | | Wuhan | China | 376 | 1,234 | 73 (+ 3 below ground)[69] | 2021 |
| 57 | Dabaihui Plaza |  | Shenzhen | 375.6 | 1,232 | 70 (+ 4 below ground) | 2021 |
| 58 | Central Plaza |  | Hong Kong | 373.9 | 1,227 | 78 (+ 3 below ground)[70] | 1992 |
| 59 | Federation Tower (East Tower) |  | Moscow | Russia | 373.7 | 1,226 | 93 (+ 4 below ground)[71] | 2016 |
| 60 | Dalian International Trade Center |  | Dalian | China | 370.2 | 1,215 | 86 (+ 7 below ground)[72] | 2019 |
| 61 | Address Boulevard |  | Dubai | United Arab Emirates | 370 | 1,214 | 73 (+ 3 below ground)[73] | 2017 |
| 62 | Haitian Center Tower 2 |  | Qingdao | China | 368.9 | 1,210 | 73 (+ 6 below ground)[74] | 2021 |
| 63 | Golden Eagle Tiandi Tower A |  | Nanjing | 368.1 | 1,208 | 77 (+ 4 below ground)[75] | 2019 |
| 64 | Bank of China Tower |  | Hong Kong | 367 | 1,205 | 72 (+ 4 below ground)[76] | 1990 |
| 65 | Bank of America Tower |  | New York City | United States | 365.8 | 1,200 | 55 (+ 3 below ground)[77] | 2009 |
| 66 | St. Regis Chicago | 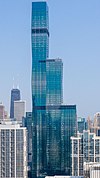 | Chicago | 362.9 | 1,191 | 92 (+ 5 below ground)[78] | 2020 |
| 67 | Almas Tower |  | Dubai | United Arab Emirates | 360 | 1,181 | 68 (+ 5 below ground)[79] | 2008 |
| 68 | Hanking Center | 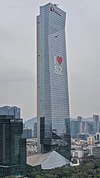 | Shenzhen | China | 358.9 | 1,177 | 65 (+ 5 below ground)[80] | 2018 |
| 69 | Greenland Group Suzhou Center[81] | | Suzhou | 358 | 1,175 | 77 (+ 3 below ground)[82] | 2022 |
| 70 | Gevora Hotel |  | Dubai | United Arab Emirates | 356.3 | 1,169 | 75 (+ 2 below ground)[83] | 2017 |
| 71 | Galaxy World Tower 1[84] | | Shenzhen | China | 356 | 1,168 | 71 (+ 5 below ground) | 2023 |
| Galaxy World Tower 2[85] |
| Il Primo Tower[86] | | Dubai | United Arab Emirates | 356 | 1,168 | 79 | 2022 |
| 74 | JW Marriott Marquis Dubai Tower 1 |  | 355.4 | 1,166 | 82 (+ 2 below ground)[87][88] | 2012 |
| JW Marriott Marquis Dubai Tower 2 | 2013 |
| 76 | Emirates Office Tower | | 354.6 | 1,163 | 54[89] | 2000 |
| 77 | Raffles City Chongqing T3N |  | Chongqing | China | 354.5 | 1,163 | 79 (+ 3 below ground)[90] | 2019 |
| Raffles City Chongqing T4N | 74 (+ 3 below ground)[91] |
| 79 | OKO – South Tower | 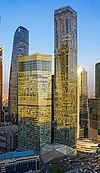 | Moscow | Russia | 354.2 | 1,162 | 90 (+ 2 below ground)[92] | 2015 |
| 80 | The Marina Torch |  | Dubai | United Arab Emirates | 352 | 1,155 | 86 (+ 4 below ground)[93] | 2011 |
| 81 | Forum 66 Tower 1 | 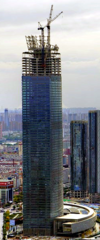 | Shenyang | China | 350.6 | 1,150 | 68 (+ 4 below ground)[94] | 2015 |
| 82 | The Pinnacle |  | Guangzhou | 350.3 | 1,149 | 60 (+ 6 below ground)[95] | 2012 |
| 83 | Xi'an Glory International Financial Center | | Xi'an | 350 | 1,148 | 75 (+ 4 below ground)[96] | 2021 |
| 84 | Spring City 66 |  | Kunming | 349 | 1,145 | 61 (+ 4 below ground)[97] | 2020 |
| 85 | 85 Sky Tower |  | Kaoshiung | Taiwan | 347.5 | 1,140 | 85 (+ 5 below ground)[98] | 1997 |
| 86 | Aon Center |  | Chicago | United States | 346.3 | 1,136 | 83 (+ 5 below ground)[99] | 1973 |
| 87 | The Center |  | Hong Kong | China | 346 | 1,135 | 73 (+ 3 below ground)[100] | 1998 |
| 88 | Neva Tower 2 |  | Moscow | Russia | 345 | 1,132 | 79 (+ 3 below ground)[101] | 2020 |
| 89 | 875 North Michigan Avenue (formerly John Hancock Center) |  | Chicago | United States | 343.7 | 1,128 | 100 (+ 1 below ground)[102] | 1969 |
| 90 | Shimao Global Financial Center |  | Changsha | China | 343 | 1,125 | 74 (+ 4 below ground)[103] | 2020 |
| 91 | Four Seasons Place Kuala Lumpur |  | Kuala Lumpur | Malaysia | 342.5 | 1,124 | 75 (+ 4 below ground)[104] | 2018 |
| 92 | ADNOC Headquarters | | Abu Dhabi | United Arab Emirates | 342 | 1,122 | 65 (+ 2 below ground)[105] | 2015 |
| 93 | One Shenzhen Bay Tower 7 |  | Shenzhen | China | 341.4 | 1,120 | 71 (+ 3 below ground)[106] | 2018
|


0 Comments